Magnetic resonance imaging (MRI) is one of the most frequently utilized imaging techniques in preclinical research due to its ability to non-invasively generate multiparametric data related to tissues and organs. The small size of animal models requires a high spatial resolution, which in turn places significant demands on the signal-to-noise ratio (SNR).
MRI systems are designed to produce images with excellent signal-to-noise ratios (SNR) by employing powerful magnets that function at high and ultra-high magnetic fields, as well as specialized radiofrequency coils and scanning electronics. However, the quality of MRI images can be affected by various factors, including thermal noise from objects and receivers influenced by specific hardware configurations, the type of tissue being scanned, and the parameters of the imaging sequence.
Noisy images can stem from experimental conditions when: (i) small voxel volumes are utilized to spatially resolve specific structures (ii) averaging might be either undesirable or impractical, (iii) approaches that necessitate signal attenuation for contrast generation such as diffusion MRI and relaxometry, or (iv) parallel imaging approaches are applied.1,4.
Images that contain significant noise can hinder visual interpretation and lead to a sensitivity that is insufficient for detecting subtle signal variations, such as those observed in functional MRI experiments.
Processing approaches like registration or conducting quantitative MRI, e.g., tensor estimation in diffusion tensor imaging, can be more difficult.3 Denoising algorithms to enhance qualitative and quantitative measures of noisy images are thus employed more and more in MRI.5
Intelligent noise suppression
With ParaVision 360 V3.6, Bruker introduced Smart Noise Reduction, a new image reconstruction practice for diminishing and removing noise from MRI images. The Smart Noise Reduction image reconstruction process is built upon residual convolutional neural networks familiar with the noise structure, which can be removed from the original data.
The networks underwent training through supervised learning techniques, excluding any generative methods. A data consistency parameter allows for a customizable denoising intensity, which helps to prevent excessive smoothing while maintaining image contrast. By leveraging this data consistency alongside an iterative denoising method known as Pre-Denoising, there can be a notable enhancement in the quality of the final images.
The Smart Noise Reduction system consists of three distinct neural networks, each varying in architecture and scale for effective noise removal. The compact network (referred to as Quick) offers the fastest processing speeds, whereas the larger and more resilient networks (Strong and Large) are designed to minimize reliance on noise characteristics.
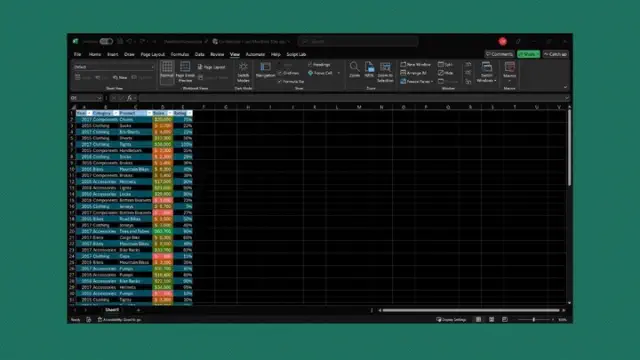
Figure 1 illustrates the denoising results achieved by the three networks. A reference 3D dataset that has undergone denoising was utilized to demonstrate the impact of the different networks on the denoising process.
Simulated noise at two different levels (with standard deviations of 0.05 and 0.1) was introduced to the reference image, which subsequently served as input for the three denoising networks: Quick, Strong, and Large. Each dataset underwent denoising at both a 50% pre-denoising level and a full 100% denoising level.
View pictures in App save up to 80% data.
Figure 1. Smart Noise Reduction using different neuronal networks. A denoised 3D dataset was taken as ground truth (Reference) to which two varying levels of simulated noise were added, i.e. standard deviation (Std.) 0.05 and 0.1, respectively. Noisy data were subsequently reconstructed with the Quick, Strong, and Large networks. All data were denoised with a 100% denoising level and 50% pre-denoising. The area shown in the red box was selected for the similarity metrics in Table 1. Image Credit: Bruker BioSpin - NMR, EPR and Imaging
Assessment of performance
One of the main difficulties in denoising structural MR images is the need to reduce noise without compromising important details, edges, and small structures that are essential for accurate image interpretation and analysis. Additionally, the denoising process must avoid introducing artifacts or altering any features that are not inherently part of the original subject.
In order to evaluate the quality of the reconstructed images shown in Fig. 1, we measured the Peak Signal to Noise Ratio (PSNR) and the Structural SIMilarity (SSIM) index between the reference image and the data reconstructed using three different networks, as presented in Table 1.
Figure 1 illustrates the selected area for analysis. While utilizing the extensive network yields the best performance, both the Quick and Strong networks also generate high-quality images.
Table 1. Quantitative comparison of performance of three neuronal networks for Smart Noise Reduction. For the SSIM index 0 indicates no similarity and 1 indicates perfect similarity. Bold indicates the best performing network. Source: Bruker BioSpin - NMR, EPR and Imaging
| Noise | Metric | Quick | Strong | Large |
|---|---|---|---|---|
| Std. 0.05 | PSNR | 37.272 | 38.592 | 39.152 |
| SSIM | 0.9439 | 0.9657 | 0.9711 | |
| Std. 0.1 | PSNR | 34.239 | 35.380 | 35.939 |
| SSIM | 0.9332 | 0.9483 | 0.9531 |
Beyond the choice of network, choosing a denoising level is also possible. Fig. 2A shows the effect of applying different denoising levels for reconstructing images. Mouse brain data was obtained ex vivo, and the original data was reconstructed without denoising and while heightening denoising levels (70-100%).
Gradually increasing the denoising levels effectively eliminated noise from the images without introducing any artifacts during the process. Analyzing the difference image between the original and the images that were 70% denoised indicated that only the noise was selectively removed.
When the original signal at the edges of an image is diminished due to reasons like bandwidth choice or excessive denoising (for instance, at levels of 90% or 100%), the edges may become indistinct. Therefore, it is crucial to determine the optimal denoising level that balances effective noise reduction and the preservation of edge sharpness, which should be tailored to each specific dataset or application protocol at the very least.

View pictures in App save up to 80% data.
Figure 2. The effect of image denoising on image quality. A) Applying increasing levels of denoising. Shown are axial images of a 3D T1-weighted FLASH ex vivo data of a fixed mouse head acquired at 9.4 Tesla without (Source) and different levels (70-100%) of denoising. A difference image between the source and 70% denoised images was computed. B)-D) Comparison of in vivo images reconstructed with no denoising and with 70% denoising. B) Coronal T2-weighted TurboRARE images of a mouse brain acquired at 3 Tesla. C) Coronal 3D FISP images of mouse kidney acquired at 7 Tesla. D) Short axis view of a mouse heart acquired with a flow-compensated triggered FLASH sequence at 9.4 Tesla. For different data, either no denoising (Source) or denoising using individual networks and a pre-denoising of 50% was applied (Denoised). Image Credit: Bruker BioSpin - NMR, EPR and Imaging
The usefulness of Smart Noise Reduction was shown in-vivo mouse data of different organs obtained at various magnetic field strengths (Fig. 2B-D). Compared to the reference images of the brain, kidney, and heart, reconstruction with 70% denoising provided images with considerably less noise and improved appearance of anatomical details and edges.
To test the denoising algorithm’s performance with images of different levels of tissue contrast, ex vivo data of a fixed mouse brain was obtained with a nominal voxel size of 55 x 55 x 800 µm3 at 3 Tesla, either without any averaging or 4 or 15 averages (as shown in Fig. 3).
This results in a contrast-to-noise ratio of 2.47±0.45, 4.59±0.01, and 12.03±0.81 for the corpus callosum compared to the cortex. The images were reconstructed in two ways: without any denoising and with 70% and 100% denoising applied.
Due to the relatively high resolution, the image captured without averaging exhibits low tissue contrast and includes noise, which can be mitigated through averaging during the acquisition process or by applying denoising techniques during image reconstruction. However, when comparing denoised images generated with varying averaging methods, it becomes evident that denoising may inadvertently enhance misleading contrast in scenarios characterized by low tissue contrast, as seen in Fig. 3, indicated by the arrow.

View pictures in App save up to 80% data.
Figure 3. Denoising images with low tissue contrast. A) Axial T2-weighted TurboRARE images of a fixed mouse head were acquired at 3 Tesla with 1, 4 and 15 number of
averages (NA), respectively. Images have a nominal voxel resolution of 55 x 55 x 800 μm3. Image reconstruction was performed without (Source) and with 70% and 100% denoising. Each denoised image was reconstructed with a network Strong and a pre-denoising of 50% was applied. The arrows point to a structure in the NA1 images, that is faintly visible in the image that has not been denoised and that becomes more apparent with increasing denoising. The arrowheads point to the corpus callosum which becomes more visible. Resolution of fine structure requires high tissue contrast with averaging. Image Credit: Bruker BioSpin - NMR, EPR and Imaging
The structure, although barely discernible in the noisy image without any denoising, becomes more apparent with increased levels of denoising, despite its proximity to the surrounding tissue. Analyzing images at varying averaging levels reveals that the corpus callosum is more clearly defined with denoising applied (illustrated in Fig. 3, indicated by arrowheads). However, to fully resolve the intricate boundaries of the corpus callosum, a high tissue contrast achieved through averaging is essential. When this condition is met, denoising significantly improves the clarity of the visualization.
Quicker imaging
Collecting MRI data can be a time-consuming endeavor, with acquisition durations extending as spatial resolution improves, particularly when comprehensive volumetric coverage is required or when multiple contrast images or quantitative datasets are collected. The demand for obtaining high signal-to-noise ratio (SNR) data swiftly is significant. In this context, Bruker demonstrates the application of Smart Noise Reduction technology to effectively reduce noise in rapid structural brain imaging.
Fig. 4 displays examples of ex vivo brain scans of different contrasts and orientations gathered in less than 5 minutes. The data was obtained from 3, 7, and 9.4 Tesla tools. To achieve the desired short acquisition time, standard protocols prepared for each system were improved by removing averaging, as seen in Fig. 4A-C.
This led to acquisition times that were 7 to 15 times quicker than the initial protocols. However, the selected resolution meant that without averaging, the images were quite noisy. By applying a denoising algorithm to the acquired data, we effectively eliminated the noise, resulting in high-quality images.

View pictures in App save up to 80% data.
Figure 4. Examples of fast brain scans. Ex vivo data of a fixed mouse head acquired with different image contrasts, geometries and orientations. Data were acquired at A) 3 Tesla, B) 7 Tesla, and C) 9.4 Tesla. Images were reconstructed with no denoising (Source) and with a network Strong and applying 50% pre-denoising and a denoising level of 70% (Denoised). Image Credit: Bruker BioSpin - NMR, EPR and Imaging
Multiple methods to accelerate MRI acquisitions by employing temporal or spatiotemporal redundancy of the images have been used in the literature.6 Approaches such as parallel imaging deliver structured noise in the reconstructed image as the decreased data sampling and noise amplification result from the parallel reconstruction algorithm.1
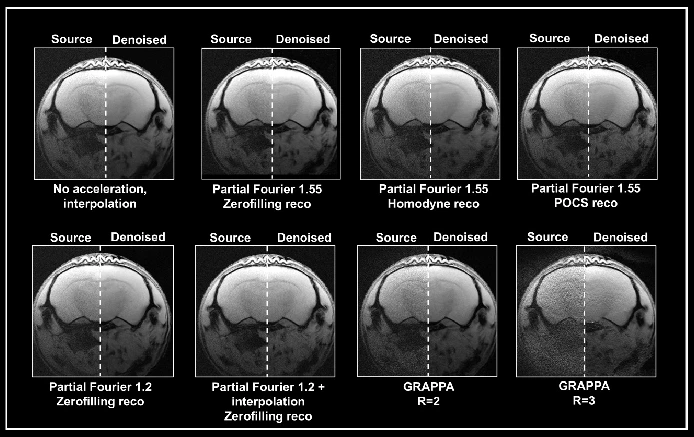
Ex vivo brain data were obtained with either partial Fourier or the multi-coil generalized auto-calibrating partial parallel acquisition (GRAPPA) approach (Fig. 5). Data obtained without acceleration served as a reference. Acceleration translated into an up to 3-fold decrease in acquisition times compared to the protocol when no averaging was used.
View pictures in App save up to 80% data.
Figure 5. Denoising of accelerated brain data. Ex vivo T1-weighted FLASH data of a fixed mouse head were acquired at 9.4 Tesla. Data were either acquired with no acceleration, with partial Fourier (in Read), partial Fourier and interpolation (1.35 in Read and Phase), or with multi-coil parallel imaging technique GRAPPA. For GRAPPA, an acceleration factor (R) of 2 and 3 was chosen, respectively. Partial Fourier images were reconstructed either with zerofilling, homodyne, or POCS, as indicated. All images are shown with no denoising (Source) and after denoising (Denoised) with a Strong network, applying a pre-denoising level of 50% and denoising level of 70%. Image Credit: Bruker BioSpin - NMR, EPR and Imaging
A denoising level of 70% resulted in increased residual noise in data acquired with a partial Fourier 1.55 when compared to data obtained without any acceleration. This effect was particularly pronounced in homodyne-reconstructed data, while it was less noticeable in zero-filled data. Additionally, the denoising process applied to these accelerated datasets caused image blurring, with the most significant blurring observed in homodyne-reconstructed images, and the least blurring occurring in images reconstructed using zero-filling techniques.
Using partial Fourier 1.2 for image acquisition resulted in reduced residual noise and a typical image appearance after applying a 70% denoising process. In contrast, when partial Fourier was combined with interpolation (1.35 in Read and Phase), the denoising proved to be ineffective, as both the original and denoised images exhibited a similar look.
The use of Grappa acceleration resulted in images that were noisier compared to those acquired using partial Fourier techniques. However, applying a denoising algorithm to the data obtained helped eliminate the noise present in the GRAPPA images, particularly those acquired with an acceleration factor of 2.
Nevertheless, the image produced with an acceleration factor of 3 still contains some residual noise. In addition, there are noticeable reconstruction artifacts and a reduction in tissue contrast that are not associated with the denoising process.
This indicates that the algorithm might struggle to process data exhibiting a noise profile that differs from the noise patterns used during the training of the networks (for instance, in the absence of acceleration and interpolation). However, the results are influenced by the chosen acquisition and reconstruction settings.
Denoising techniques can improve images when the signal-to-noise ratio (SNR) is compromised due to faster imaging protocols. By modifying these protocols, it is possible to shorten acquisition times, which can lead to reduced exposure for animals involved in the study. This refinement of the method not only minimizes animal exposure but also allows for additional read-outs during MRI scans, enhancing efficiency for research objectives.
Enhancing image resolution over time.
High-resolution MRI yields intricate images of tissues and organs, aiding in the identification of abnormalities like lesions or tumors. Nevertheless, these detailed structural MRI scans require extended image acquisition periods to mitigate the naturally low signal-to-noise ratio (SNR). Bruker showcases the effectiveness of Smart Noise Reduction in reducing acquisition times without compromising image quality.
View pictures in App save up to 80% data.
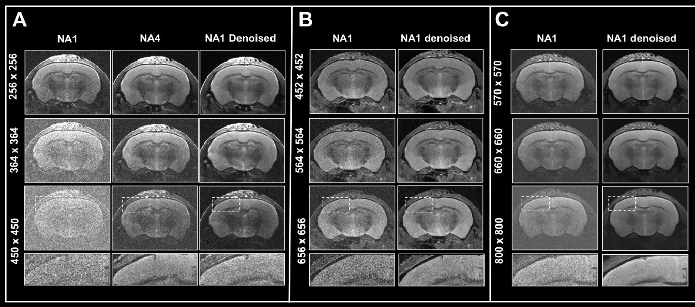
Figure 6. Boosting resolution. Ex vivo T2-weighted TurboRARE data of a fixed mouse head acquired at A) 3 Tesla, B) 7 Tesla, and C) 9.4 Tesla. All images were acquired with 0.8 mm (A) and 0.7 mm (B, C) slice thickness and with a field-of-view of 20 x 20 mm2 and the given matrix size using either no averaging or acquiring 4 averages. Images were reconstructed with no denoising (NA1 and NA4), or after denoising (NA1 Denoised) using a network Large, applying a pre-denoising level of 50% and denoising level of 70%. Image Credit: Bruker BioSpin - NMR, EPR and Imaging
In Fig. 6, axial T2-weighted TurboRARE images of a fixed mouse head obtained at various field strengths are contrasted. Images were obtained via a fixed field-of-view of 20 x 20 mm2, with 0.8 mm (3 Tesla) and 0.7 mm (7 and 9.4 Tesla) thick slices and with diverse matrix sizes to generate images with various spatial resolutions.
It is important to highlight that the matrix dimensions were increased by factors of 1.8, 2.6, and 3.1 compared to the reference protocols' matrix size of 256 for images captured at 3, 7, and 9.4 Tesla, respectively. This enhancement in resolution resulted in a corresponding decrease in signal-to-noise ratio (SNR) for each image. To compensate for the reduction in SNR, averaging techniques were employed, and consequently, additional data was collected using four averages.
A comparison between non-denoised averaged images and individual averaged images indicated that denoising effectively decreases the heightened image noise present at higher resolutions, producing images that are comparable in quality to those achieved through the averaging process.
Denoising leads to notable enhancements in image quality, particularly with data collected at 3 Tesla. In this case, increasing the resolution results in images that are harder to interpret. In contrast, data from 7 and 9.4 Tesla inherently possess a higher signal-to-noise ratio (SNR), making them easier to analyze.
Regardless, images captured at 7 and 9.4 Tesla greatly benefit from denoising during the reconstruction process, as the naturally higher signal-to-noise ratio (SNR) of these images allows for the selection of smaller voxel sizes. Consequently, denoising empowers researchers to achieve higher resolutions within a specified timeframe, thanks to a diminished requirement for averaging. This approach can also prove useful in situations where averaging is either not preferred or not feasible.
Summary
Smart Noise Reduction effectively eliminates noise from structural images, enhancing overall image quality. By offering various denoising levels and network options, users can optimize the denoising outcomes to suit their specific requirements.
Noisy images can be enhanced even in situations where the signal-to-noise ratio (SNR) is low, such as when images are captured at reduced field strengths, when ideal coils are not accessible, or when averaging methods are either not feasible or not preferred. When the SNR is adequate, denoising techniques can be applied to improve resolution for a given time frame or to optimize the speed of the acquisition process.
Suggested readings and additional resources
- Aja-Fernández, S., Vegas-Sánchez-Ferrero, G. and Tristán-Vega, A. (2013). Noise estimation in parallel MRI: GRAPPA and SENSE, Magnetic Resonance Imaging, 32(3), pp. 281–290. https://doi.org/10.1016/j.mri.2013.12.001.
- Griswold, M.A. et al. (2002). Generalized autocalibrating partially parallel acquisitions (GRAPPA), Magnetic Resonance in Medicine, 47(6), pp. 1202–1210. https://doi.org/10.1002/mrm.10171.
- Huang, H. et al. (2004). Analysis of noise effects on DTI‐based tractography using the brute‐force and multi‐ROI approach, Magnetic Resonance in Medicine, 52(3), pp. 559–565. https://doi.org/10.1002/mrm.20147.
- Macovski, A. (1996). Noise in MRI, Magnetic Resonance in Medicine, 36(3), pp. 494–497. https://doi.org/10.1002/mrm.1910360327.
- Mishro, P.K. et al. (2021). A survey on State-of-the-Art Denoising Techniques for brain magnetic resonance images, IEEE Reviews in Biomedical Engineering, 15, pp. 184–199. https://doi.org/10.1109/rbme.2021.3055556.
- Pruessmann KP;Weiger M;Scheidegger MB;Boesiger P (2012). SENSE: sensitivity encoding for fast MRI. Magnetic resonance in medicine, [online] 42(5). Available at: https://pubmed.ncbi.nlm.nih.gov/10542355/.
Bruker BioSpin specializes in advanced scientific instruments and solutions for nuclear magnetic resonance (NMR), electron paramagnetic resonance (EPR), and imaging technologies. Their cutting-edge equipment is widely used in various fields such as chemistry, biology, and materials science, enabling researchers to gain deep insights into molecular structures and dynamics. With a commitment to innovation and quality, Bruker BioSpin supports the scientific community in pushing the boundaries of research and discovery.
Welcome to Bruker BioSpin and the world's most comprehensive range of NMR and EPR spectroscopy and preclinical imaging research tools. The Bruker BioSpin Group of companies develop, manufacture and supply technology to research establishments, commercial enterprises and multi-national corporations across countless industries and fields of expertise.
Bruker BioSpin is at the forefront of transforming the design, production, and distribution of tools for life sciences, preclinical studies, process control, and analytical research, utilizing magnetic resonance and multimodal imaging technologies. As the global leader in magnetic resonance technologies (NMR, EPR), Bruker BioSpin boasts the most extensive range of imaging modalities for preclinical and industrial research, all under one unified brand.
Sponsored Content Policy: News-Medical.net publishes articles and related content that may be derived from sources where we have existing commercial relationships, provided such content adds value to the core editorial ethos of News-Medical.Net which is to educate and inform site visitors interested in medical research, science, medical devices and treatments.